

Dashboard
Dashboard is the main control page in Splynx which will help you check financial and customer statistics on a daily basis. From the dashboard, you can monitor system performance and immediately get information about your network devices health and the state of other modules. Using the Shortcuts feature gives you access to regular actions in Splynx.
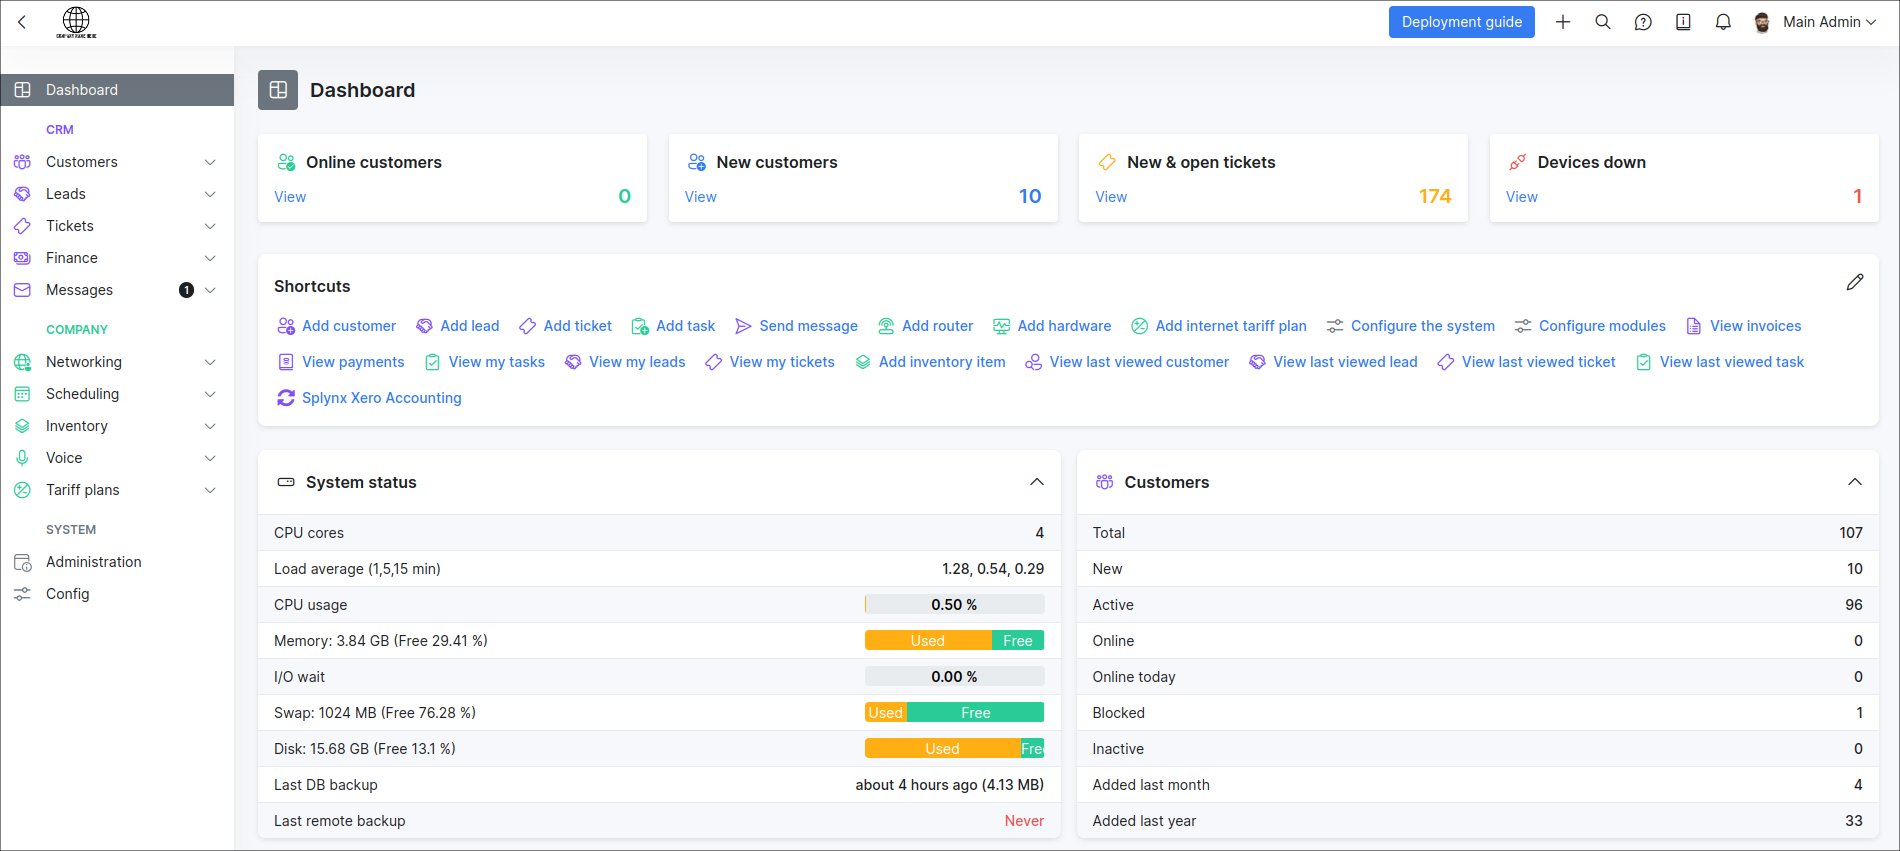

At the top of the live dashboard you can find the blocks with the summarized information about the number of online customers, new customers, new and open tickets and the number of devices down in your network.
In order to open a more detailed list of the data presented in the blocks, just click on the required block, it helps to quickly jump to the full list of necessary information.


Shortcuts
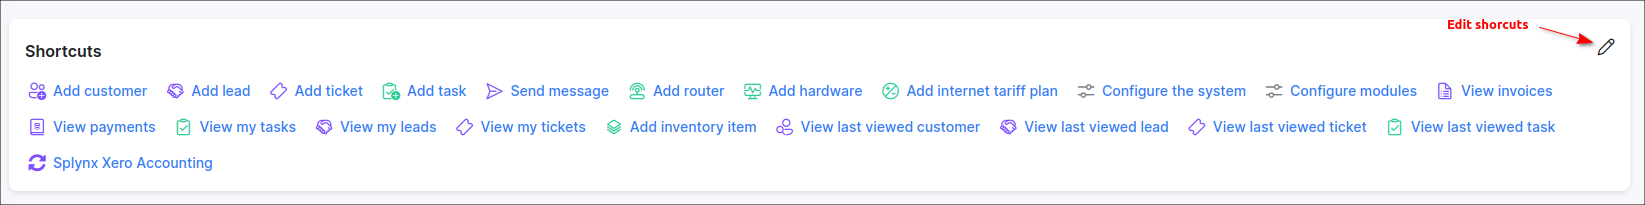
On this panel are provided the quick actions available in Splynx. The list of available actions depends on the role of the account and its permissions.
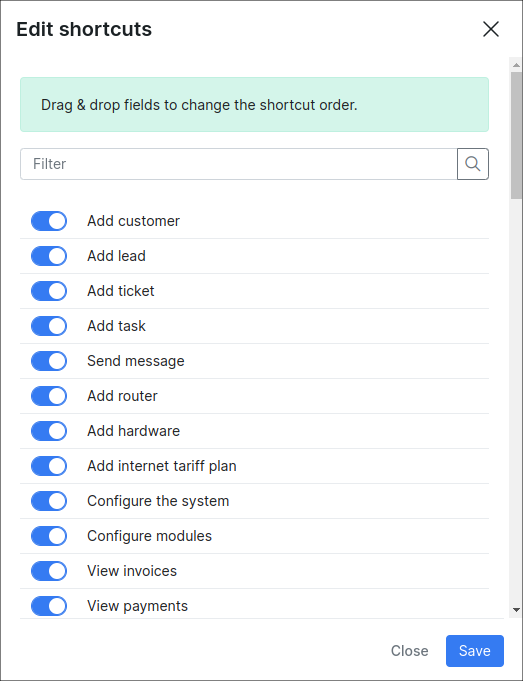
Note, when we install at least one add-on on the system, its item will be available in the Edit shortcuts menu.
Use the menu to enable/disable the desired items or change their order.
Live dashboard
Live dashboard is divided into 6 main parts:


Main sidebar
The navigation sidebar on the left side has the following modules:
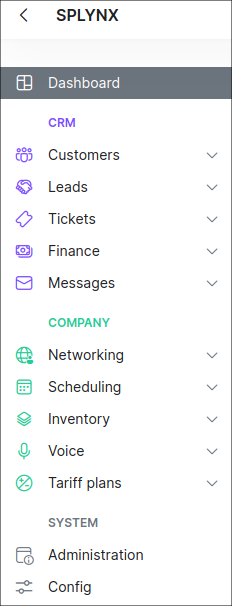
CRM:
-
Customers - the configurable list of all customers in the system;
-
Leads - the configurable list of all leads in the system;
-
Tickets - the ticketing system and the place of support communication;
-
Finance - all aspects related to your finance;
-
Messages - the support communication system for all your customers;
COMPANY:
-
Networking - the networking management platform;
-
Scheduling - the To Do list for your technical staff;
-
Inventory - the physical devices and the equipment are managed here;
-
Voice - the voice rates and CDR processing management;
-
Tariff Plans - the list of all your services and products in the system;
SYSTEM:
-
Administration - the administrative page of your Splynx server;
-
Config - the place where all settings for each module are located.
In the upper right corner of the page the ACCOUNT menu is located with the next modules:
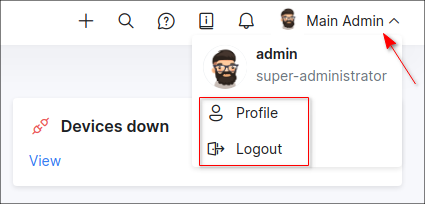
-
Profile - the profile page of the administrator currently logged into the system;
-
Logout- the option to logout from the system
Top bar features

| Icon | Description |
|---|---|
 |
the list of recommended and additional steps for successful deployment. |
 Quick addition |
the following actions available: Add customer, Add lead, Add ticket, Add task, Add internet tariff plan. |
 Search |
the global search of Splynx. |
 Help and Support |
create a new ticket for Splynx support. |
 Documentation |
open the documentation in the sidebar. Each article can be opened in a new window. In addition, you can search for the guide you need by keywords. |
 Notifications |
the list of recent notifications. |
Deployment guide
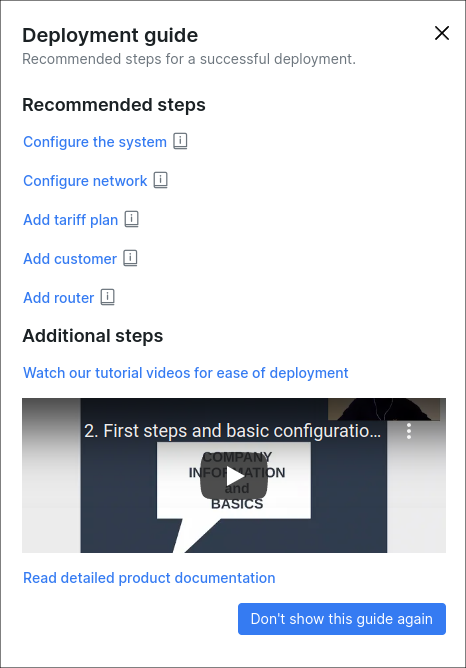
The must-have information and tutorials that simplify system deployment for new users.
Quick addition
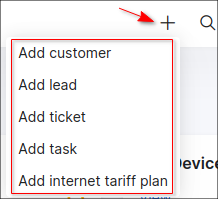
If you are on some Splynx page, other than Dashboard, you can easily perform actions such as Add customer, Add lead, Add ticket, Add task or Add internet tariff plan by clicking on quick action icon.
Global search
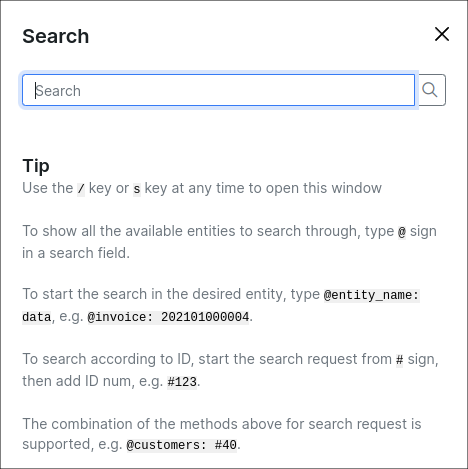
→ How to use the global search in Splynx
Help and Support
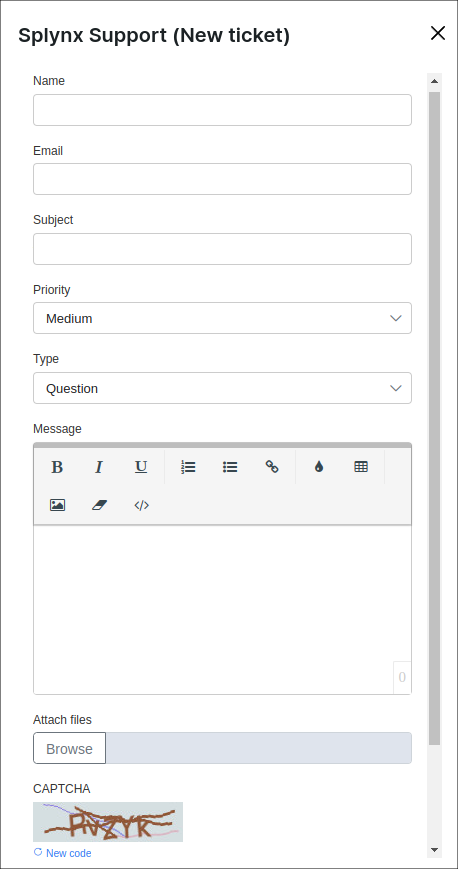
The action is used to create a ticket for Splynx support team. Please, use this option when it's strictly necessary and after the related documentation is examined.
Documentation
![]()
It's provided the instant access to the appropriate documentation in the Splynx window. Depending on which page you are on, the necessary manual will be opened on the right sidebar after clicking on the icon or pressing the d hot key at any time. The manual can be opened in a separate tab of the web browser and you can navigate to the Table of contents of the full documentation or search the necessary guide as well.
Notifications
![]()
The list of the recent events in Splynx, e.g. a new ticket was received, etc.
Enjoy your work with Splynx!